Section 11.2 Task Manager
The Task Manager displays all the applications and processes running on the Windows Server 2003 computer. It also displays some common performance measures. You can access the Task Manager by pressing CTRL + ALT + delete on the keyboard and selecting the Task Manager button from the pop-up menu; or right-click an empty area of the taskbar and select Task Manager.
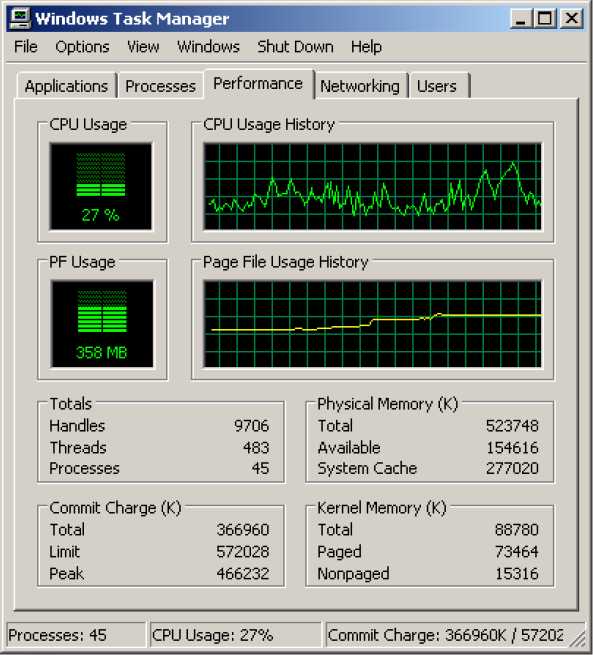
Figure 11.1: The Windows Server 2003 Task Manager
As illustrated in Figure 9.1, the Performance tab of Task Manager, displays the CPU and memory usage of the system. The CPU Usage section displays the current CPU usage as a percentage of the maximum CPU utilization. The CPU Usage History section plots the recent CPU usage on a graph and is an indicator for the behavior of the CPU utilization of the system. The PF Usage section displays the current Page File usage in megabytes (MB) while the Page File Usage History section plots the recent Page File usage on a graph. The Totals section displays the total handles, threads, and processes currently running
on the system. The Physical Memory section displays the total available memory, the amount currently available, and the System Cache size. The Commit Charge section is related to the Kernel Memory section and displays the virtual memory details.