Section 13.2: General Troubleshooting Model
You should deploy a systematic troubleshooting technique that can eliminate different possibilities and move step-by-step toward the real causes of the problem. The following is a generally accepted troubleshooting model. It presents a flow chart that can effectively guide you through your troubleshooting tasks.
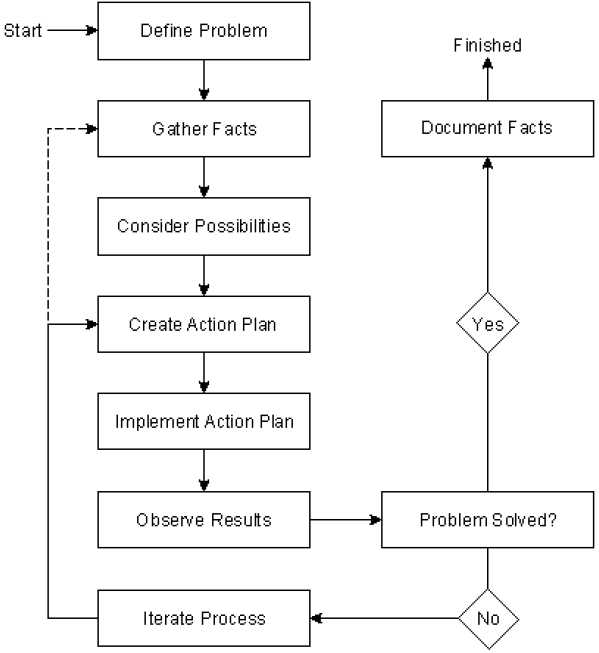
• Define the problem in terms of the associated symptoms and possible causes.
• Gather facts from different sources. Talk to network administrators, other support engineers, managers, and anyone that can provide relevant information. Run some basic tests (such as ping, trace, etc).
• Consider all possibilities and eliminate the improbable possibilities so as to set a boundary for the problem area. Order the possibilities that you believe might be the cause of the network problem based on their likelihood.
• Create an action plan for each possibility in order to solve the problem. Ensure the security and performance implications of each of your proposed actions are acceptable.
• Implement the action plan for each possibility in the order of their likelihood. Every action and change must be documented so that you can reverse your actions if they are not appropriate.
• Observe the results of each action. See if the problems or symptoms have been eliminated and that other normal network operations are not disrupted or adversely affected.
• Document the facts and report the problem as solved if the symptoms have disappeared and the problem has been solved without creating new ones. Documenting your work will save you and others a lot of time and effort in the future. Also document the date and time that you made changes.
• Go through an iteration process of implementing actions and observing results if there are still unresolved issues. Consider the next action plan and go about implementing it. There will be times that you remain with no possibility in hand while your network problems persist. In this event, you will have to think of more possibilities. This may require that you gather more facts that you might have overlooked.
13.2.1: Troubleshooting with show Commands
There are a number of show commands that you can use for troubleshooting hardware, configuration, or network problems in a switched network environment. These commands are:
• show system, which displays the power supply, fan, temperature alarm, system, and modem status; the number of days, hours, minutes, and seconds since the last system restart; the baud rate; the MAC address range; and the system name, location, and contact.
• show arp, which displays the contents of the ARP table and aging time.
• show atm, which displays the ATM interfaces, traffic, VC and VLAN information and status.
• show cam dynamic, which displays the dynamic CAM table.
• show config, which displays the current system configuration.
• show fddi, which displays the settings of the FDDI/CDDI module.
• show flash, which displays the Flash code names, version numbers, and sizes.
• show interface, which displays the Supervisor module network interface information.
• show ip route, which displays the IP route information.
• show log, which displays the system or module error log.
• show mac, which displays the MAC counters for all the installed modules.
• show module, which displays module status and information.
• show nets tat, which displays statistics for the various TCP/IP stack protocols and state of active network connections.
• show port, which displays the port status and counters for all installed modules.
• show spantree, which displays the Spanning Tree information for the VLANs, including port states.
• show system, which displays the status of the power supply, fan, temperature alarm, system, and uptime.
• show test, which displays the results of diagnostic tests on the specified modules.
• show trunk, which displays the ISL/Dot1Q information including trunking status.
• show vlan, which displays the virtual LAN type, status and assigned modules and ports.
13.2.2: Physical Layer Troubleshooting
The most common network problems can be traced to cable problems. Check that the correct cable is used. Category 3 cabling can only support 10BaseT. Check whether a 10/100-Mbps connection is connected at 10 Mbps instead of 100 Mbps. Check whether the cable is a crossover, rollover or straight-through cable by comparing the RJ-45 connector wiring at both ends of the cable, including all wiring closet connections. Check the devices' port link integrity LED on both ends of the cable.
13.2.3: Troubleshooting Ethernet
Table 13.3 outlines problems commonly encountered on Ethernet networks.
Table 13.2: Ethernet Media Problems
Media Problem
Possible Solution
Excessive noise Use the show interfaces ethernet EXEC command to
determine the status of the router's Ethernet interfaces. Check cables to determine whether any are damaged. Look for badly spaced taps that could be causing reflections. If you are using 100BaseTX, make sure you are using Category 5 cabling.
Excessive collisions Use the show interfaces ethernet command to check the
rate of collisions. Use a time domain reflectometer (TDR) to find any unterminated Ethernet cables. Look for a jabbering transceiver attached to a host.
Excessive runt frames In a shared Ethernet environment, runt frames are almost
always caused by collisions. If the collision rate is high, refer to the problem "Excessive collisions" earlier in this table.
If runt frames occur when collisions are not high or in a switched Ethernet environment, then they are the result of underruns or bad software on a network interface card.
Use a protocol analyzer to try to determine the source address of the runt frames.
Late collisions (collision Use a protocol analyzer to check for late collisions. Late that occurs beyond the collisions usually occur when Ethernet cables are too long or first 64 bytes of an when there are too many repeaters in the network.
Ethernet frame) Check the diameter of the network and make sure it is within
specification.
No link integrity on Make sure you are not using 100BaseT4 when only two 10BaseT 100BaseT4, or 100BaseTX pairs of wire are available.
100BaseT4 requires four pairs. Check for 10BaseT, 100BaseT4, or 100BaseTX mismatch. Determine whether there is cross-connect. Check for excessive noise.
13.2.3.1: Network Testing
The ping command is one of the most useful troubleshooting tools when performing network testing. The ping command is supported at the user and privileged exec modes. In user mode, you must specify an IP address or a host name, if the host name can be resolved to an IP address, with the ping command. The ping command tests the round-trip path to and from a target. In privileged mode, you must enter a protocol, a target IP address, a repeat count, datagram size, and a timeout in seconds. Generally, the syntax for the ping command is:
ping -s ip_address [ packet_size] [ packet_count]
Table 13.3: Parameters for the ping Command
Parameter
Purpose
Causes ping to send one datagram per second, printing one line of output for every response received. The ping command does not return any output when no response is received.
ip_address
Packet_size
Packet count
The IP address or IP alias of the host.
This optional parameter represents the number of bytes in a packet, from 1 to 2000 bytes, with a default of 56 bytes. The actual packet size is eight bytes larger because the switch adds header information.
This optional parameter represents the number of packets to send.
13.2.3.2: The Traceroute Command
The traceroute command was introduced with the release 10.0 of Cisco IOS and can be used to find the path between IP devices. The traceroute command can be executed in user and privileged exec modes, but in privileged exec mode, you can use the extended traceroute, which is more flexible and informative. This command can be very useful in troubleshooting by determining where along a particular network path a particular problem might be as the traceroute command displays a hop-by-hop path through an IP network from the switch to a specific destination host. The syntax for the traceroute command is:
traceroute [ -n ] [- w wait_time ] [ -i initial_ttl ] [ -m max_ttl ]
[ -p dest_port ] [ -q nqueries ] [ -t tos ] ip_address [ data_size ]
Table 13.4: Parameters for the traceroute Command
Parameter
Description
-w wait time
-i initial ttl
-m max ttl
-p dest port
-q nqueries
-t tos
Prevents traceroute from performing a DNS lookup for each hop on the path. Only numerical IP addresses are printed.
Specifies the amount of time that traceroute will wait for an ICMP response message. The allowed range for wait time is 1 to 300 seconds; the default is 5.
Causes traceroute to send ICMP datagrams with a TTL value equal to initial_ttl instead of the default TTL of 1. This causes traceroute to skip processing for hosts that are less than initial_ttl hops away.
Specifies the maximum TTL value for outgoing ICMP datagrams. The allowed range is 1 to 255; the default value is 30.
Specifies the base UDP destination port number used in traceroute datagrams. This value increments each time a datagram is sent. The allowed range is 1 to 65535; the default base port is 33434.
Specifies the number of datagrams to send for each TTL value. The allowed range is 1 to 1000; the default is 3.
Specifies the TOS to be set in the IP header of the outgoing
datagrams. The allowed range is 0 to 255; the default is 0.
ip_address data size
IP alias or IP addressin dot notation of the destination host.
Number of bytes, in addition to the default of 40 bytes, of the outgoing datagrams. The allowed range is 0 to 1420; the default is 0.
13.2.3.3: Network Media Test Equipment
Third party equipment that can be used to troubleshoot networks includes:
• Volt/Ohm meters and digital multimeters used to check for cable connectivity and continuity.
• Cable testers or scanners, also test for connectivity but are more sophisticated than Volt/Ohm meters. Are able report cable conditions such as attenuation, near-end crosstalk (NEXT), and noise. Can also provide the measurement of a cable's impedance.
• TDRs and OTDRs, devices that provide time domain reflectometer (TDR and optical TDR or OTDR for fiber-optic cable testing), wire-map, and traffic monitoring functionality. Can locate opens, shorts, kinks, sharp bends, crimps, and impedance mismatches
• Breakout Boxes, Fox Boxes, and bit/block error rate testers (BERTs/BLERTs) are digital interface testing tools used to measure the digital signals present at computers, printers, modems, CSU/DSUs, and other peripheral interfaces. These devices can monitor data line conditions, analyze and trap data, and diagnose problems common to data communication systems. Traffic from data terminal equipment (DTE) through data communications equipment (DCE) can be examined to help isolate problems, identify bit patterns, and ensure that the proper cabling has been installed.
• Network monitors, Layer 2 tools used to capture, display and save traffic passing through a network cable. Can take the raw data and provide information on frame sizes, number of erroneous frames, MAC addresses, number of broadcasts, etc.
• Network analyzers are similar to network monitors but are capable of interpreting and displaying the packet, segment, and other (higher) protocol data units (PDUs). Can be used to study the format or behavior of certain protocols; to check time delays between request and response.